-
Courses
Courses
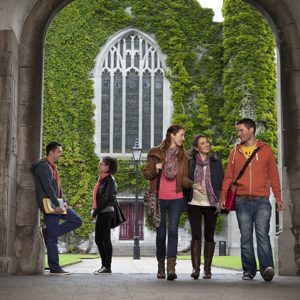
Choosing a course is one of the most important decisions you'll ever make! View our courses and see what our students and lecturers have to say about the courses you are interested in at the links below.
-
University Life

University Life
Each year more than 4,000 choose University of Galway as their University of choice. Find out what life at University of Galway is all about here.
-
About University of Galway

About University of Galway
Since 1845, University of Galway has been sharing the highest quality teaching and research with Ireland and the world. Find out what makes our University so special – from our distinguished history to the latest news and campus developments.
-
Colleges & Schools
Colleges & Schools
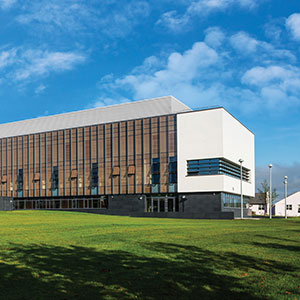
University of Galway has earned international recognition as a research-led university with a commitment to top quality teaching across a range of key areas of expertise.
-
Research & Innovation

Research & Innovation
University of Galway’s vibrant research community take on some of the most pressing challenges of our times.
-
Business & Industry
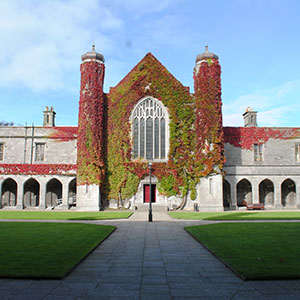
Guiding Breakthrough Research at University of Galway
We explore and facilitate commercial opportunities for the research community at University of Galway, as well as facilitating industry partnership.
-
Alumni & Friends
Alumni & Friends
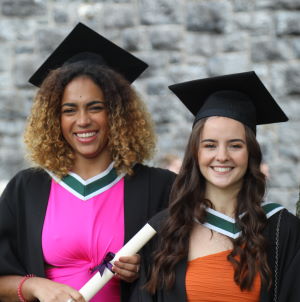
There are 128,000 University of Galway alumni worldwide. Stay connected to your alumni community! Join our social networks and update your details online.
-
Community Engagement
Community Engagement
At University of Galway, we believe that the best learning takes place when you apply what you learn in a real world context. That's why many of our courses include work placements or community projects.
 Accessibility & Language
Facts & Figures
Numbers are a key part of understanding where there is potential for disadvantage and under-representation in our University. Combined with qualitative information the OVPEDI is building a picture of the diversity and lived experience of our staff and student body. Knowledge of this data allows us to establish baselines, develop targeted actions, monitor data changes, analyse, and report progress.
Numbers are a key part of understanding where there is potential for disadvantage and under-representation in our University. Combined with qualitative information the OVPEDI is building a picture of the diversity and lived experience of our staff and student body. Knowledge of this data allows us to establish baselines, develop targeted actions, monitor data changes, analyse, and report progress.
The table below shows a summary of the staff and student diversity metrics for the academic year 2025-26
|
Diversity Characteristic |
Staff |
|
Student |
||||||||||||||||||||||||||||||||||||
|
Note: Gender "Other " is not displayed due to small numbers. |
|
|
|
||||||||||||||||||||||||||||||||||||
|---|---|---|---|---|---|---|---|---|---|---|---|---|---|---|---|---|---|---|---|---|---|---|---|---|---|---|---|---|---|---|---|---|---|---|---|---|---|---|---|
|
|
|
|
|
||||||||||||||||||||||||||||||||||||
| Note: Student age @Dec 2025 | |||||||||||||||||||||||||||||||||||||||
|
|
|
|
|||||||||||||||||||||||||||||||||||||
| Note: Student nationality is based on the domiciled country | |||||||||||||||||||||||||||||||||||||||
 |
On the diversity section within the Core Portal, staff can now update additional diverse metrics. To date, 5.4% of staff have disclosed that they are from an ethnic minority group |
|
In the 2025/26 Equal Access Survey distributed to the First Year New Entrants enrolling on a Full Time Undergraduate degree, 9.7% of the student respondents were from an ethnic minority group. |
||||||||||||||||||||||||||||||||||||
 |
On the diversity section within the Core Portal, staff can now update additional diverse metrics. To date, 2.2% of Staff reported a disability |
|
In the 2025/26 Equal Access Survey distributed to the First Year New Entrants enrolling on a Full Time Undergraduate degree, 19.7% of the student respondents reported having some type of disability. |
||||||||||||||||||||||||||||||||||||

HEA Reports
All Higher Education Institutions are required to submit their student and staff profiles annually to the HEA.
Reports and information relating to Student Data can be found on the HEA Institutions' Student Statistics
Reports and information relating to Staff Gender Equality data can be found on the HEA Institutions' Staff Statistics